
The Treasury Yield Curve Explained
“Yield” in investing refers to the earnings realized on a given investment over a period of time. Treasury yields refer to the money an investor earns by owning US Treasury bills, notes, bonds, or inflation-protected securities.
The US Treasury yield curve compares the yields of short-term Treasury bills with long-term Treasury notes and bonds.
Types of Treasury Securities
Treasury securities are issued by the US Treasury Department and are divided into three categories based on the length of their maturity.
- Treasury Bills: T-Bills have the shortest maturities of all government bonds: four weeks, three months, 13 weeks, 26 weeks, and 52 weeks. T-Bills are issued at a discount and mature at par value, with the difference between the purchase and sale prices constituting the interest paid on the bill, also called the coupon.
- Treasury Notes: T-Notes are the middle range of maturity lengths: two-year, three-year, five-year, seven-year, and 10-year. Notes are issued at $100 par value and mature at the same price, paying a coupon semiannually.
- Treasury Bonds: T-Bonds, or “long bonds,” are essentially the same as T-Notes except they mature in 20 and 30 years.
How Does Monetary Policy Impact Bonds?
One fundamental principle of fixed-income investing is that market interest rates and bond prices have an inverse relationship. A primary focus of monetary policy is determining interest rates, based on the federal funds rate.
Among many other uses, the fed funds rate is used to determine the risk-free rate of return, which greatly impacts the demand for all types of financial securities, including bonds.
The risk-free rate of return is the hypothetical rate of return of an investment with “zero” risk. While this is hard to guarantee, government bonds are considered the closest to risk-free. In turn, the interest rate on three-month Treasurys is often used as a proxy for the risk-free rate of return for US investors.
The Federal Reserve has currently been implementing one of the steepest interest rate hike programs in decades, which has had a massive impact on the bond market. Bond prices tend to fall when the cost of borrowing money rises (as interest rates climb).
What is a Yield Curve?
Interest rates are often talked about as a singular thing, as though all rates behave in the same way. However, the reality is that rates on various bonds often behave quite differently depending on their duration.
A yield curve is a way to visualize these differences. The yield curve is a graphical representation of the yields available for bonds of equal credit quality and different maturity dates. It can also serve as a measurement of bond investors’ feelings about future risk.
If you understand how the federal funds rate and the bond market impact the overall financial markets, a yield curve can be used to help gauge the direction of the U.S. economy.
Understanding the Treasury Yield
The Treasury Department sets a fixed face value and interest rates when issuing Treasurys. These notes are then sold at auction.
High demand drives price above the face value. That decreases the yield because the government will pay back only the face value plus the stated interest rate.
Low demand drives the price below the face value. That increases the yield because the buyer paid less for the bond but receives the same interest rate. Yields always move in the opposite direction of Treasury bond prices.
Treasury yields continuously change, because they’re resold daily on the open market.
How Do Treasury Yields Affect the Economy?
As Treasury yields rise, so do the interest rates on consumer and business loans with similar maturities. Investors enjoy the safety and fixed (guaranteed) returns of bonds. Treasurys are the safest since they’re guaranteed by the US government.
Other bonds, such as municipal and corporate bonds, are riskier and must return higher yields in order to attract investors. These bonds are considered riskier because there is a chance of default, these bonds are not backed by the full faith of the US government. To remain competitive, interest rates on other bonds and loans increase as Treasury yields rise.
When yields rise on the secondary market, the government must pay a higher interest rate to attract buyers in future auctions. Over time, these higher rates increase the demand for Treasurys.
That’s how higher yields can increase the value of the dollar over the long term.
Three Types of Yield Curves
The shape of the yield curve can inform you how investors feel about the economy. For that reason, they are a useful indicator of investor sentiment as well as economic growth. The types vary on the slope of the yield curve.
Graphs are included as examples of the following yield curves where the maturity of the bond is on the x-axis and the Treasury yield is on the y-axis.
Normal Yield Curve

A normal yield curve is what we expect the yield curve to look like when investors are confident about the economy’s future, the curve will have an upward slope. This indicates that 30-year Treasury bonds are offering the highest returns, while 1-month Treasury securities are offering the lowest returns.
This scenario is considered normal because investors are compensated for holding long-term securities, which possess greater investment risks due to duration. The normal yield curve implies that both fiscal and monetary policies are expansionary and the economy is likely to expand in the future.
Flat or Humped Yield Curve
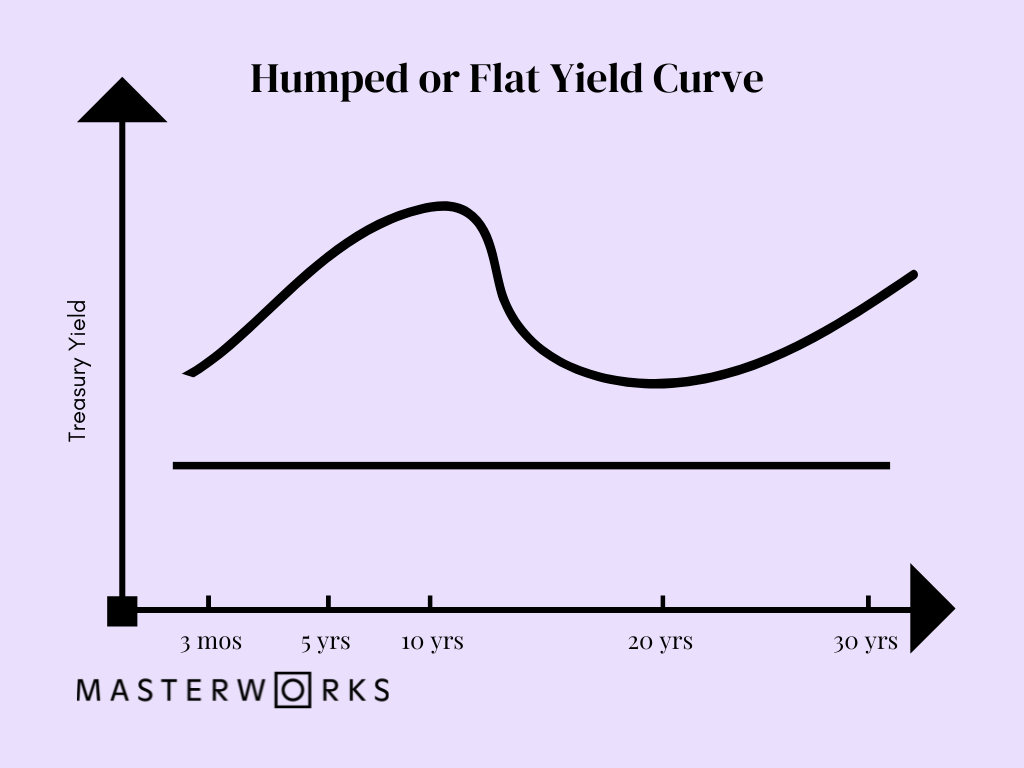
A flat yield curve is when the yields are low across the board. This shows that investors expect slow growth, but not negative growth. This could signal that economic predictors are sending mixed messages, and some investors expect growth while others are unsure.
When the yield curve is flat, borrowers are not going to save as much with a 15-year mortgage compared to a 30-year. A flat yield curve means that banks are likely not lending as much as they should because they don’t receive a lot more return for the heightened risk of lending out money for longer periods of time. As a result, they will often only lend to low-risk customers.
Humped yield curves are relatively rare, resulting when the interest rate on medium-term fixed-income securities is higher than both long and short-term bonds. These are also called bell-shaped curves.
Inverted Yield Curve

When the yield curve inverts, it means longer-dated bonds will offer a lower annual yield than a short-dated bond. This means investors have bid up the prices on longer-dated bonds to the point where they yield less than short-dated bonds.
Economists often take this to mean investors have little confidence in the near-term economy, which can forecast a recession.
To make up for this low confidence, investors demand more yield for a short-term bond than for a long-term one. They would prefer to buy long-term bonds and tie up money for years, even though they receive lower bonds.
Using Yield Curves
In addition to using the shape of the Treasury yield curve to help determine the current future strength of the economy, the Treasury yield curve is also useful for comparing all yield curves as it is generally regarded as the “benchmark curve.”
Yields on Treasury bonds and other government bonds are generally among the lowest because they are some of the safest, as they are backed by the full faith and credit of the US government. This allows bond investors to compare the Treasury yield curve with that of riskier assets such as Agency bonds or A-rated corporate bonds, or even junk bonds.
Understanding Yield Spreads
The yield difference between the two yield curves is called the “yield spread.” The closer the yields are together, the more confident investors are in taking the risk in a bond that is not government-backed. The spread typically widens during recessions and contracts during recoveries.
Economic theory and academic studies of the relationship between an inverted yield curve and recessions have tended to look at the spread between the 10-year Treasury yield and the three-month Treasury yield, while market participants have more often focused on the yield spread between the 10-year and 2-year Treasury.
Historical Examples of Inverted Yield Curves
The US recessions of 2020, 2009, 2001, and all others back to 1960 were preceded by yield curve inversions.
In 2006, the spread inverted for much of the year. Long-term Treasury bonds went on to outperform stocks during 2007. The Great Recession began in December 2007.
On March 31, 2022, the two-year Treasury yield and the 10-year Treasury yield officially inverted for the first time since 2019. Based on 50 years of data, the 2022 yield curve inversion signals a recession by 2024.
The Bottom Line
If the yield curve is inverted, should we panic? Chair of the US central bank, Jerome Powell, has said no. Earlier this year, he said he pays more attention to the first 18 months of the yield curve than what’s going on between the yields of two-year and 10-year bonds.
Many investors may still worry, whether they are worried about general Wall Street volatility, an impending recession, high inflation, rising interest rates, or any number of other variables. In the current interest rate environment, bond yields should be increasing.
Like other economic indicators, the yield curve is used by a variety of policymakers, investors, and economists to forecast economic conditions. While it has a strong track record, the yield curve alone cannot fully inform an investor of where the economy is headed.
It’s important to keep multiple metrics in mind when making investment decisions based on speculation.